Multi-table
The multi-table object allows the linking of various tables, cross tables and charts. This enables you to combine various table listings with graphical reports via the charting object, without having to create new report layouts.
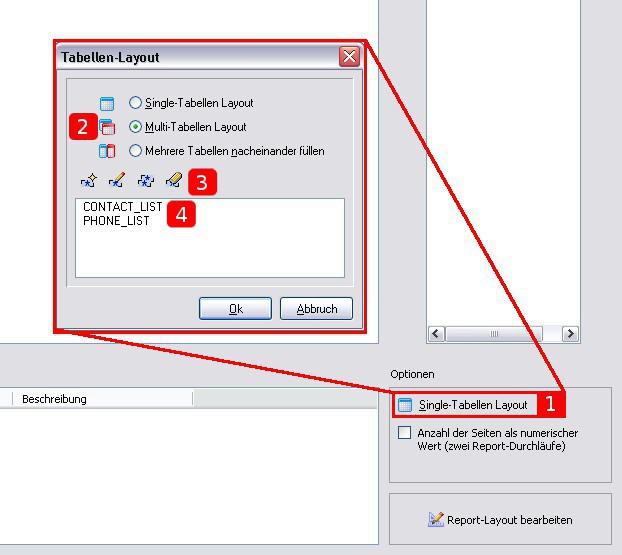
In order to gain access to this functionality, you have to activate the multi-table layout (2) in the general report settings under "Options" (1). You can then create as many tables (4) as required in the dialog window, using the various functions (3).
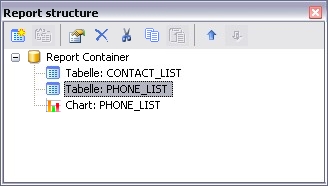
These tables are now available in the report layout. Create your table object as usual. In doing so NotesToPaper will automatically create the required report structure and provide the created tables in a separate dialog. The report structure now serves as a tool to navigate through the created tables, in order to customize them to your requirements.
Cross table
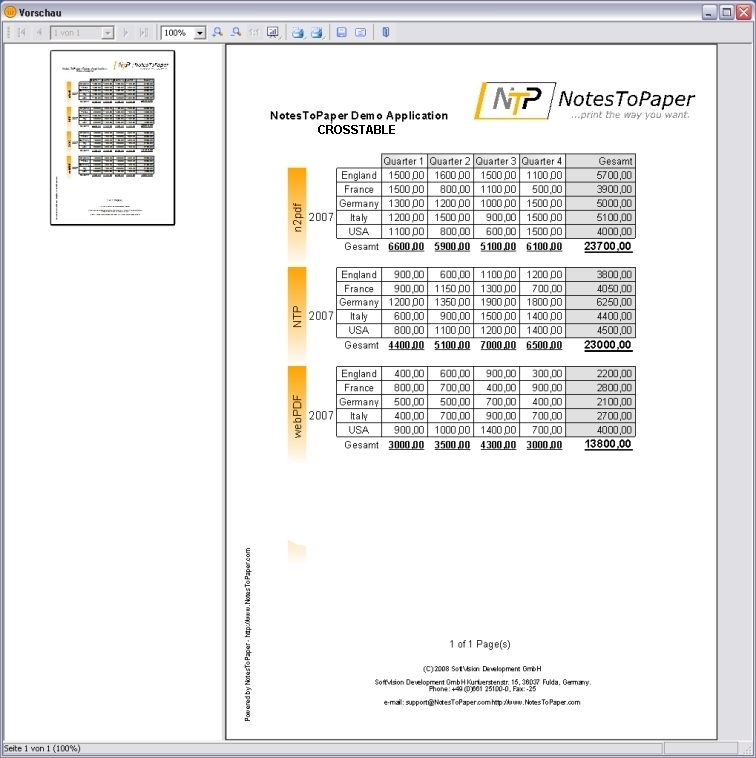
When you ask yourself:
"How much turnover was achieved with the different products in the main sales countries in each quarter of the current business year?"
the statistic could be displayed with an ordinary table, but this table can only display two dimensions. The resulting chart would fill several pages. The cross table object structures your evaluation and allows you to add as many dimensions as required to your x and y axis.
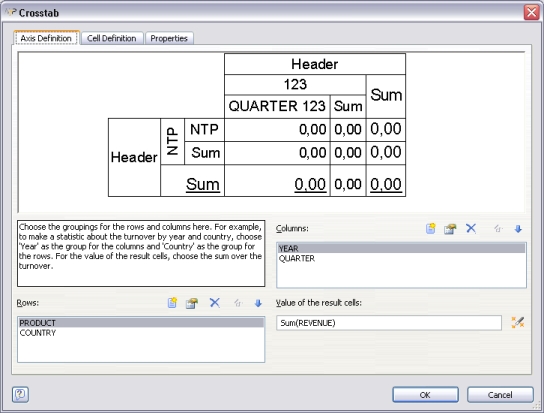
In order to create the object, you have to select the button for the cross table object in the object bar of the report designer. You can now create a frame in the desired size (just as an ordinary table), as usual.
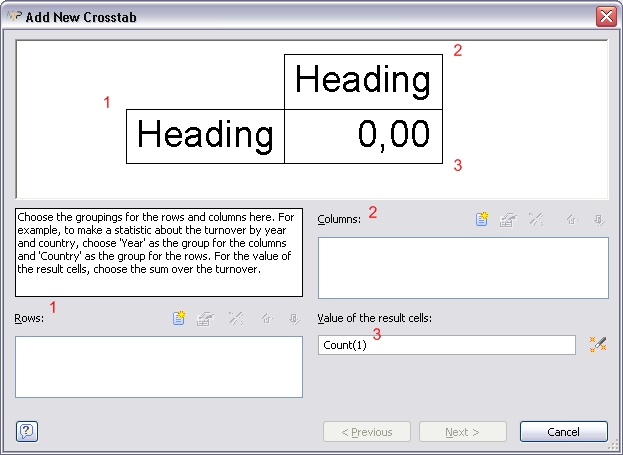
As soon as you have created the cross table object, the dialog Add new cross tab will open automatically.
Rows (1) contain horizontal information, whereas all vertical information can be placed in the columns (2).You can define the basis of calculation, with which the intersection is to be displayed, in the Value of the result cells (3).