Callnumber

+49 661 25100-0 support & infohotline
More Products
Our Partners
Oracle Gold Partner

Callnumber

+49 661 25100-0 support & infohotline

NotesToPaper 10.0

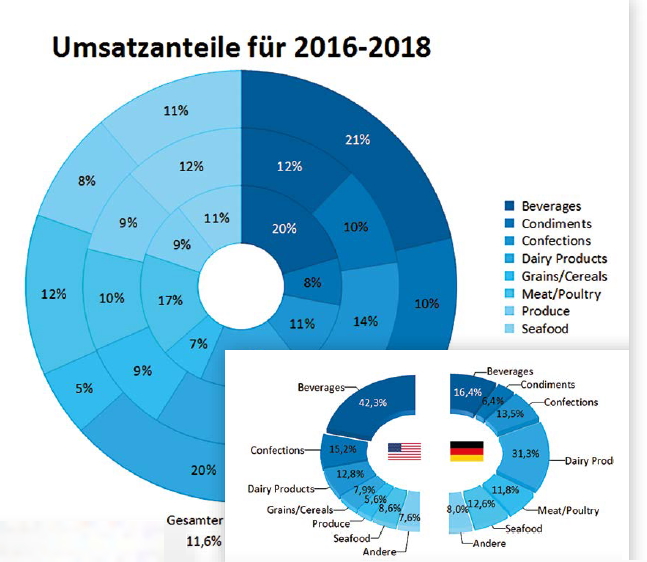
What's new in the pie/doughnut chart

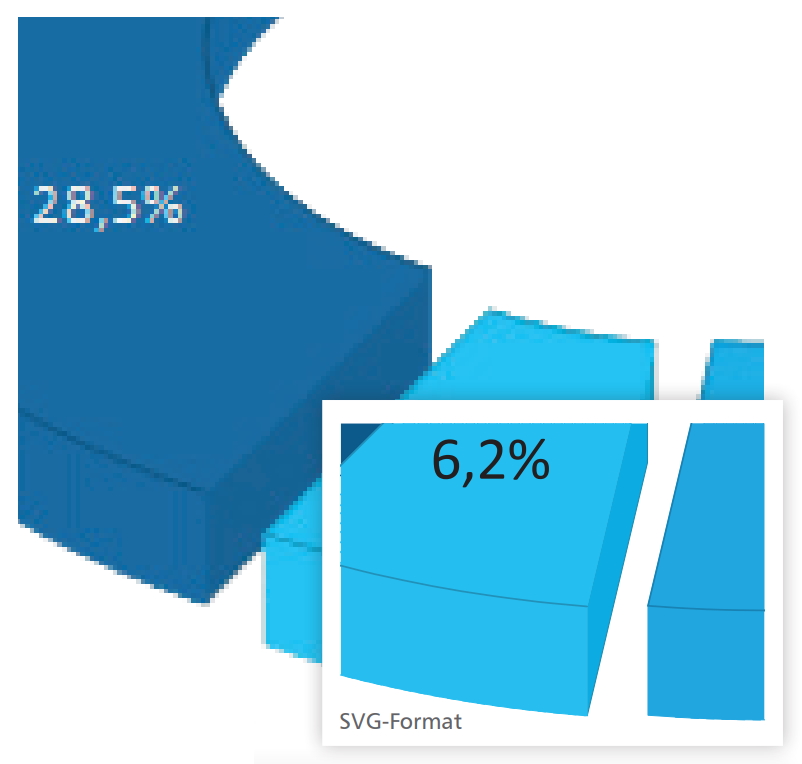
It is possible to define several data series in the doughnut chart, which are displayed as circles lying inside each other. This makes it easy to compare different time periods, for example. All variants of the pie/doughnut charts can now also consist of a section instead of the complete circle, for example to display the data in a semicircle.

Increased print performance

Numerous optimizations in the preparation of the actual data structure used for printing and export have significantly reduced the load on the database server. This accelerates the print speed.

Acceleration at design start

The designer loads much faster, especially when a large data structure is used.

Signal areas

Certain signal areas can now be colored horizontally and vertically to draw attention to them. This makes important information in diagrams easy to grasp and evaluate, at a glance.

SVG as image format

In addition to the previous numerous image formats, images can be directly embedded in reports in SVG (Scalable Vector Graphics) format. The HTML output uses the SVG images in the original, so that the result is also optimal there.

Extensively renewed SVG export

Completely redesigned, almost all previous limitations of SVG export are removed. For display directly in modern browsers or for sharing, this format is ideal for your users, as it can be rescaled without loss and thus always provides a razor-sharp display.

Edit cross tables context-sensitive

Without going through the properties dialog, you can now change color, alignment, font, etc. directly.

Creating a cross table via drag & drop

In addition to tables, cross tables can now also be created by simply dragging fields onto the workspace.

New image formats in designer

Under Windows 10, the two new image formats HEIF and WebP can be used as graphics in the designer. This provides additional modern formats for flexible and lossless compressed images.

Country flags

The new CountryFlag function creates an SVG of the required country flag at any position.

Search and Replace

A search function, and also the corresponding replace function, are now available in the designer.

Create chart from crosstab and vice versa

Crosstabs and charts have a lot in common regarding the underlying data. Often, in addition to a crosstab in the report, a diagram is added for visualization. Now you do this directly in the object window or in the ribbon. It is also possible to convert a chart to a crosstab.

Performance

In list projects you benefit from average speed increases of 20%.

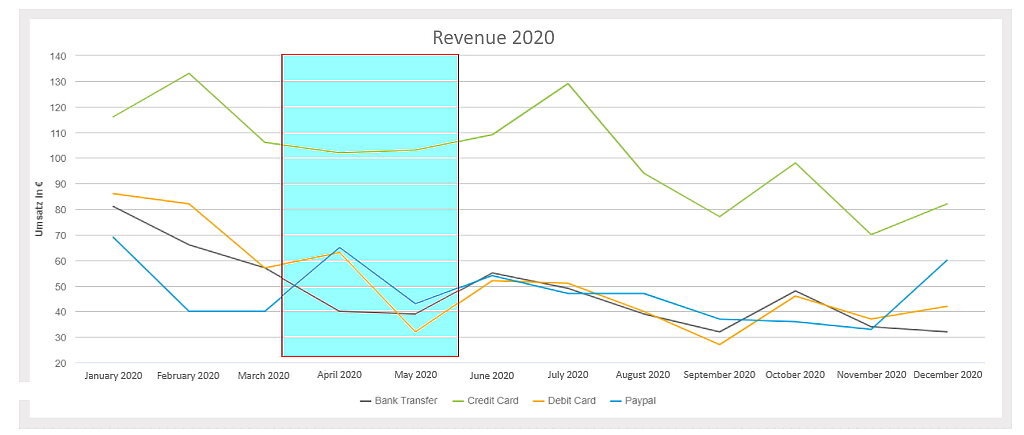
Rscript for more diagrams

NotesToPaper already offers a large number of charts. However, since there are an infinite number of types of charts and display options, we have integrated Rscript into NotesToPaper as an established language that specializes in statistical calculations and graphics and supports every conceivable visualization. This adds the huge number of charts and display possibilities of Rscript to the previous report layout options.

Unsere Kunden