A Treemap is used to visualize hierarchical data by using nested rectangles. The size of the rectangle is in proportion to the size of the value.
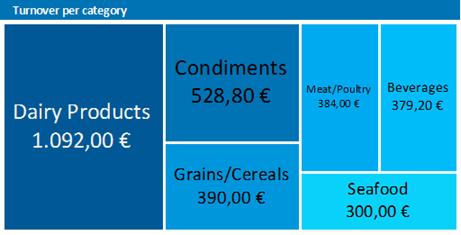
Figure 6.25: Treemap
Proceed as follows in the Sample Application
1. Select the "Customers > Orders > Order Details" table as the data source.
2. Select Treemap > Simple as the chart type
3. First specify the coordinate value for the category axis. Select the "CategoryName" field via the formula wizard.
4. Specify the coordinate values for the series axis. In the Sample Application, the order year is not supplied directly as a field, so you must calculate it using the "Year$(Orders.OrderDate)" formula.
5. Specify the coordinate values for the value axis (z-axis), i.e. calculate the turnover with the "Sum(Order_Details.Quantity * Order_Details.UnitPrice)" formula.