A radar chart is a graphical method of displaying multivariate data in the form of a two-dimensional chart of three or more quantitative variables represented on axes starting from the same point.
The radar chart is also known as web chart, spider chart, star chart or polar chart.
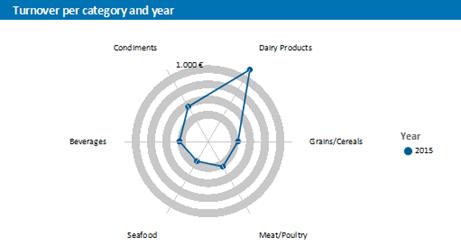
Figure 6.24: radar chart
Proceed as follows in the Sample Application
1. Select the "Customers > Orders > Order Details" table as the data source.
2. Select Radar/Web> Simple as the chart type
3. First specify the coordinate value for the category axis. Select the "CategoryName" field via the formula wizard.
4. Specify the coordinate values for the series axis. In the Sample Application, the order year is not supplied directly as a field, so you must calculate it using the "Year$(Orders.OrderDate)" formula.
5. Specify the coordinate values for the value axis (z-axis), i.e. calculate the turnover with the "Sum(Order_Details.Quantity * Order_Details.UnitPrice)" formula.