Shapefiles enable a diverse range of visualization options via a standardized vector description format. Via corresponding templates, a wide range of maps, seating charts or floor plans can be generated. The Shapefile determines the shape, and an associated attribute database enables the shapes to be referenced to the properties (e.g. country names).
Tip: The availability of this chart depends on the application.
Example: A visualization of the temperature distribution of the earth is to be generated.
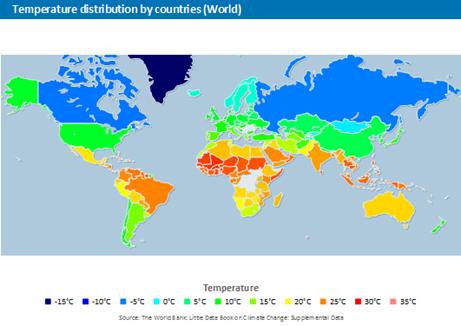
Figure 6.19: Example of a map
To do so, proceed as follows:
1. Select the table "ClimateData" as the data source.
2. As the diagram type, select Map/Shapefile. At this point, a selection dialog appears for the Shapefile templates provided with the software. Select "World With Seas and Lakes".
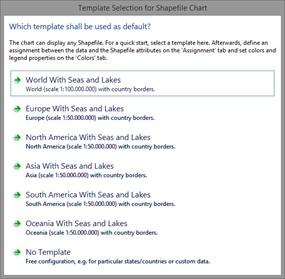
Figure 6.20: Template Selection
3. You will now see the preconfigured data Shapefile in the tab "Shapefile Selection". In addition to the data itself, you can also select foreground and background Shapefiles in order to e.g. display the oceans in the background and the rivers and lakes in the foreground.
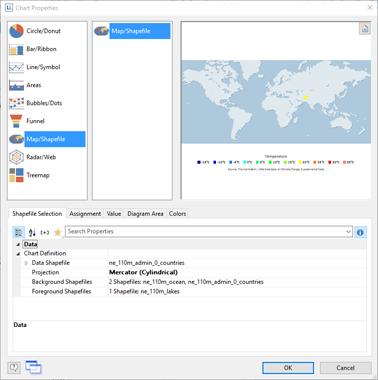
Figure 6.21: Shapefile Selection
4. Click on the "Assignment" tab in order to link the data with the shapes.
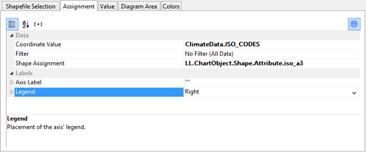
Figure 6.22: Assignment
Link the coordinate value "ISO_CODES" from the data with the attribute "iso_a3" from the Shapefile. By doing this, the data that is related to e.g. "USA" is linked to the outline of "USA"; the temperature from "United States of America" is linked to "United States of America", and so on.
5. Go to the tab "Value" and select the mean temperature as the "Value", i.e. the field "ClimateData.Tmean".
6. Go to the tab "Colors" to define the legend. As the first entry, define the color via the function HeatmapColor(LL.ChartObject.AxisCoordinate,-20,40) and set the condition to "True". The value will then be used for the actual color fill, and you will obtain a continuous fill color.
7. For the other discrete legend values, enter the corresponding functions, e.g. HeatmapColor(5,-20,40) with the legend text "5°" and set their condition to "False". This means that the value will only be used for the legend.
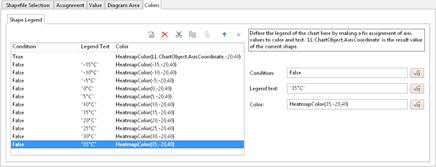
Figure 6.23: Colors and Legend