There are diverse options for displaying data graphics:
1. A data graphic as an object. Select Insert > Data Graphic (Objects > Insert > Data Graphic) and enlarge it to the desired size in the workspace by holding the left mouse button.
2. A data graphic can be displayed in a table column. For this option, select the "Data Graphic" item in the table object dialog box in the context menu. If you want to represent aggregated data there is the option of displaying the data graphic as a footer line.
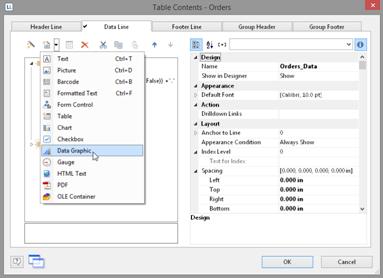
Figure 6.37: Data graphic in a table column