Under the "General" tab, you can now specify the value you would like to display in the data graphic. This determines the bar length and the symbol display.
The minimum and maximum value relates to the upper and lower limits of the representation, i.e. the minimal value is 0% in the case of percent scaling and the maximum value is 100% in the case of percent scaling. The scaling is specified in the respective "Sections" setting.
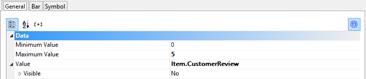
Figure 6.38: Value of the Data Graphic