With a funnel or a pipeline, you can e.g. display your sales processes in the various phases. There are a variety of options for the way the data is presented.
To do so, proceed as follows:
1. Select the appropriate data source.
2. As the diagram type, select Funnel > Vertical Funnel.
3. First of all, define the coordinate value of the data source, i.e. the value that will define the individual funnel segments (the sales phase).
4. Switch to the tab "Funnel Segment" to define the coordinate value for the size of the funnel segment (number of sales opportunities). Double-click on the "Coordinate Value" property. Now, in the subsequent dialog "Coordinate Value", select the desired aggregating function "Count" for the content.
5. For the labeling of the funnel segments with percentage values, the option "Label on Object" has already been set to "Yes". Then, via the property "Format", define the value as "Percentage (Without Decimal Places)" or as "Absolute Value".
6. You can enter an offset for the funnel values via the property "Explosion Offset".
7. In the "Chart" tab, select the general diagram options. The following properties are available (among others):
▪ Relative Width of Funnel End/Start.
▪ Color Mode, e.g. monochrome
8. In the "Chart" tab, select the general layout options of the entire object. The following properties are available (among others):
▪ Title
▪ Background incl. filling, border and shadow, e.g. border = transparent
9. In the "Colors" tab, you can configure the color options.
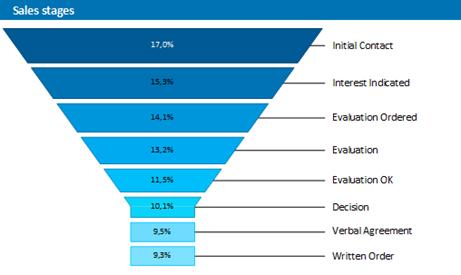
Figure 6.17: Funnel chart
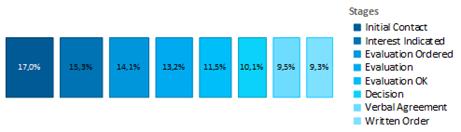
Figure 6.18: Vertical Funnel chart (Pipeline)