Assuming you have a collated data series detailing the sales figures of your products over the period of a year in the form of a table, you may now want to integrate the associated chart next to it without wasting space. Or you may want to display the customer rating of a product as a symbol. A data graphic can do this for you. These simple charts display entire information series or actual values in a single cell. This allows you to get a quick overview of the development of your data. You can select from bar graphs and symbols (e.g. arrows, stars, traffic lights).
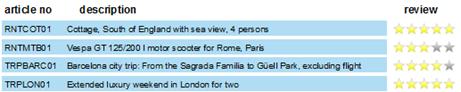
Figure 6.35: Data graphic with symbols
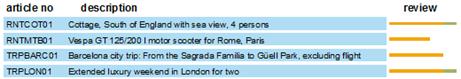
Figure 6.36: Data graphic with bars